


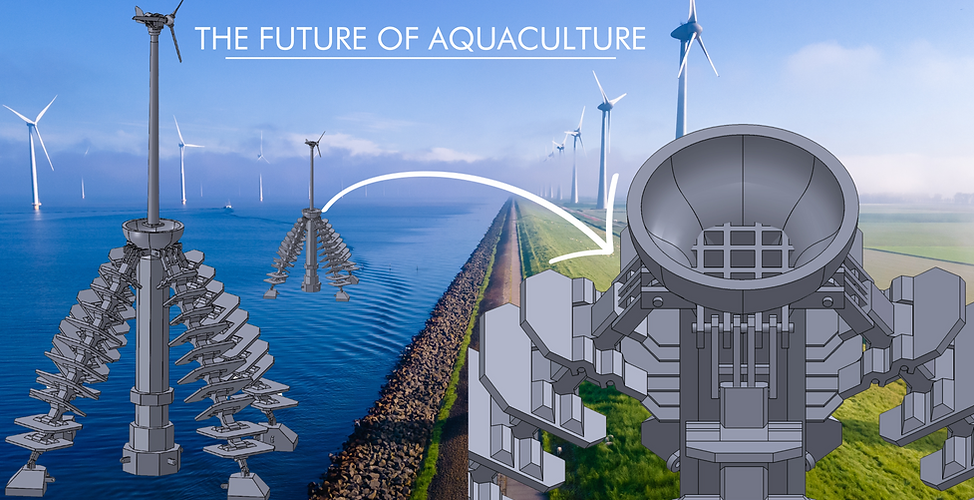
Ocean Wind Farms
Nature-Based Offset & Aquaculture Systems


Reef forests and farms are cast with our nano-composites, to cover an acre or small coral community. They are customized for targeted results within a particular site and ecosystem.

OCEAN WIND FARM SUPPORT
OR
Solar Powered Vertical Acreage Farm


For an oyster farm, the textures of the growth plate surface will be very rough and have oyster growth compounds and crushed oyster shells.
Some like it sunny, Some like it shady, diverse algae, medicinal compounds, corals or fish habitats can be grown on either side of the growth plates which can be surfaced to facilitate a certain growth matrix.
These are designed to yield the maximum crops in minimum acreage.

We continued the testing of diverse materials matrix casting with surfaces which natural ecosystems. Below are some examples of our our casted structures that can be attached to ocean wind farms.
These structures are made of proper growth substrates conducive to oyster or other marine animal/mineral/algae growth. Easily clipped onto an existing structure, these mounts are ideal for integrating renewable energy with ocean farming.
Engineers available to customize a site and solution specific structure.
What are Ocean Wind Farms?
Ocean wind farms, often referred to as offshore wind farms, represent a dynamic and promising frontier in the renewable energy landscape. Harnessing the immense power of offshore winds, these farms are strategically situated in expansive bodies of water, where wind speeds tend to be higher and more consistent than on land. The proximity to coastal population centers ensures efficient transmission of the generated electricity. One of the most compelling advantages of ocean wind farms is their potential for substantial energy generation. The unobstructed expanse of the open ocean allows for the deployment of larger and more powerful wind turbines, capable of tapping into the vast energy potential that these winds hold. Moreover, their offshore location minimizes visual and noise impacts on coastal communities, addressing some of the concerns associated with onshore wind projects. As we navigate the challenges of transitioning to a sustainable energy future, ocean wind farms emerge as a beacon of clean, reliable, and virtually limitless renewable energy, poised to play a pivotal role in reducing carbon emissions and securing a resilient energy grid.

Award-Winning drawing of our Wind Farms, Drawn by Ocean Architect Guyon Brenna.
Award Received: Buckminster Fuller Institute 2017 Catalyst Program
Project Phases
Phase 1
Mapping & Proposed Module Location:
Substrate variation based on site
Phase 2
Design & Structural Engineering:
Module Size, Shape, & Weight
Phase 3
Materials Sourcing & Remote Casting
Phase 4
Shipping & Installation
Phase 5
Aftercare: Monitoring & Scientific Reporting


Suggested Methods for Coastal Property Deployment
Study Sites:
The experiment will be conducted at the Coastal Property or Proposed Site specified site: 670280E 601855N located within Creadan Bay, a small bay located near the Ardnamult Head. Creadan Bay is characterized by a predominantly mixed sediment bottom with small patches of hard substrate in the form of boulders, making it a suitable area for rocky habitat creation in the form of artificial reefs (ARs).
At the first Coastal Property Proposed Site, we would deploy an AR array composed of 50 large Oceanite modules manufactured by IntelliReefs and 10 concrete control modules manufactured using the same molds. The Coastal Property or Proposed Site would have a mixed sediment habitat with a water depth of 5-7 m. The Oceanite modules will be approximately cubic in shape (93 cm x 93 cm footprint with an average height), with a sloping top and multiple concave indentations to mimic habitat complexity of natural rocky reefs. The Oceanite modules will be composed of a single mix (balanced mix between weight, porosity, and strength) and will be similar in height (average height: 112 cm); there will be 50 total Oceanite modules in the ReefShip shape. The 10 concrete modules to be produced using the same molds as the ReefShip modules, and will measure similar to the above. The Oceanite and concrete modules will be grouped and placed in a linear and rectangular array, where from left to right 10 concrete in an arrangement of two rows of five then 10 Oceanite in an arrangement of two rows of five then 40 Oceanite in eight rows of five; each group will be approximately 4-8 m away from each other group. Modules within a group will be spaced 1.25 m apart on average.
Sampling of Artificial Reef Community:
To monitor the development of the temperate reef community on the Oceanite ReefShip AR modules, we will conduct photo quadrat sampling to assess percent cover of benthic organisms in (TBD date 2022) three quadrant positions will be marked on each Oceanite module (2 on the top, 1 on each exposed side) using numbered ABS plastic tags affixed to the surface using Z-Spar Splash Zone underwater epoxy, for a total of 40 quadrats per array of 10 and 160 for the 40 unit array, a total of 240 quadrats between the concrete and Oceanite. Permanent quadrats enabled monitoring of consistent locations on ARs over time. Each quadrat position will be photographed by a diver using an underwater camera with an attached, custom aluminum quadrat frame measuring 35.35 cm x 35.35 cm (1/8 m2). Photographs will be analyzed in Coral Point Count with Excel Extensions (Kohler and Gill 2006) by overlaying a uniform grid of 100 points and identifying the benthic organism or substrate beneath each point.
We will use PERMANOVA (Anderson 2001) to assess the effect of substrate (fixed factor, 2 levels: concrete, Oceanite), Oceanite mix (fixed factor, 2 levels: light, dense), and surface orientation (fixed factor, 2 levels: horizontal, vertical) on benthic assemblage composition (percent cover), substrate comparison (percent cover). If significant differences are present, we will conduct SIMPER analysis (Clarke 1993) to determine the relative contribution of taxonomic groups to differences in assemblage. Non-metric multidimensional scaling (nMDS) plots with Bray-Curtis similarity matrices will be used to visualize differences in the benthic community between treatments. We also will calculate Shannon’s Diversity Index (H’; Shannon 1948) across all quadrat samples to compare the diversity on the Oceanite ARs with values from natural kelp bed ecosystems from the published literature.
Video Sampling of Motile Community:
We will monitor the motile fish and invertebrate community at the AR sites using both stationary remote video and video transects conducted by a remotely operated vehicle (ROV). Remote video will be captured at each site on (TBD date 2022), using GoPro Hero® cameras (2.7K resolution, 30-60 FPS, wide-angle lens) anchored to poles between 1 and 2 m above the seabed. The cameras will tilted downward at a slight angle to capture the seabed/artificial reef modules within the frame as well as the water column. At the AR site, cameras will be deployed by a diver and attached to a piece of rebar sticking above an AR module on each corner per each 10 group, oriented towards the adjacent modules in the group. At the reference site, the camera will be deployed the boat video will be recorded at each site for approximately 60 minutes per 10 units during each deployment.
At the AR site, transects will be conducted beginning 5 m beyond one edge of the AR array, passing through the array, and ending 5 m past the AR array. During the transects, the ROV will stop, pan and zoomed its camera as necessary when encountering fauna in order to facilitate subsequent identification (following Pelletier et al. 2011).
If found motile organisms in the stationary and transect videos estimated to be < 5 cm will be identified to the lowest possible taxonomic level and enumerated using MaxN, the maximum number of individuals of a given taxonomic identity in a given video frame (Cappo et al. 2003). We will use PEMANOVA to analyse the effect of site on composition (presence/absence) of motile fauna captured using each video method, and use nMDS plots with Bray-Curtis similarity matrices to visualize differences in the motile community between treatments.
eDNA Sampling:
We will use eDNA sampling as an additional method to compare species composition between the AR sites. At each site, a diver will collect a water sample (3 L) approximately 1-2 m from the seabed, either by a diver in a clean plastic bottle. Using aquatic eDNA sampling kits from NatureMetrics, water samples will be filtered and preserved on site and sent to NatureMetrics for metabarcoding analysis for fish, eukaryotes, and plankton.
R Packages:
All analyses will be conducted using R (R Core Team 2021) in the R Studio environment (RStudio Team 2020). Using the vegan package (Oksanen et al. 2020), PERMANOVA will be conducted using the “adonis” function, nMDS will be performed using the “metaMDS” function, and SIMPER will be performed using the “simper” function. We will construct figures using ggplot2 (Wickham 2016), with the aid of the “ordiellipse” function from vegan (Oksanen et al. 2020) for nMDS plots. Maps will be produced using ggmap (Kahle and Wickham 2013), ggrepel (Slowikowski 2019), sf (Pebesma 2018), and sp (Pebesma and Bivand 2005). Tables will be constructed using knitr (Xie 2021) and kableExtra (Zhu 2021). Data manipulation will be performed using readxl (Wickham and Bryan 2019) and tidyverse (Wickham et al. 2019).

Sustainable Renewable Energy Projects
Learn more about kelp on our Youtube channel!


Seaweed Science Posts


